Matplotlib
what it is ? matplotlib is probably the single most used Python package for 2D-graphics. It provides both a very quick way to visualize data from Python and publication-quality figures in many formats. We are going to explore matplotlib in interactive mode covering most common cases.
Example :
the first step is to get the data for the sine and cosine functions:
import numpy as np
X = np.linspace(-np.pi, np.pi, 256, endpoint=True) C, S = np.cos(X), np.sin(X) X is now a NumPy array with 256 values ranging from -π to +π (included). C is the cosine (256 values) and S is the sine (256 values).
To run the example, you can download each of the examples and run it using:
$ python exercice_1.py You can get source for each step by clicking on the corresponding figure.
Using plot() command
seaborn
As a data visualization library, seaborn requires that you provide it with data. Seaborn supports several different dataset formats, and most functions accept data represented with objects from the pandas or numpy libraries as well as built-in Python types like lists and dictionaries.
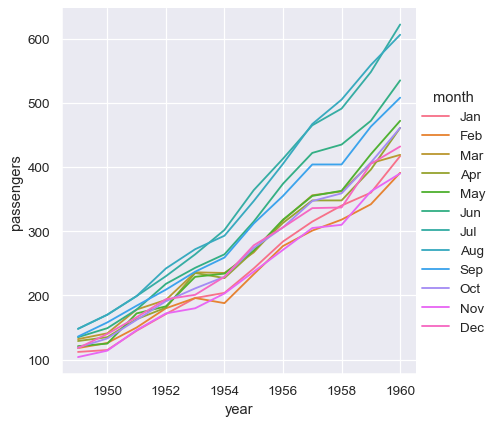
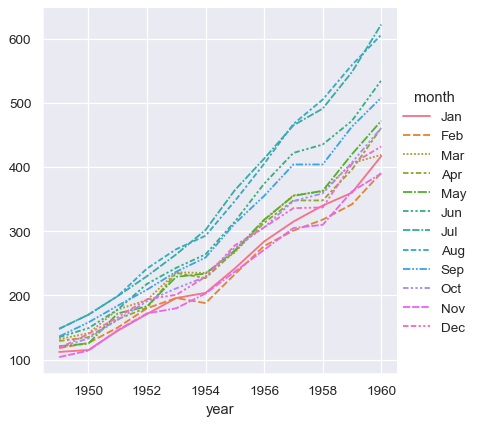
Long-form vs. wide-form data Most plotting functions in seaborn are oriented towards vectors of data. When plotting x against y, each variable should be a vector. Seaborn accepts data sets that have more than one vector organized in some tabular fashion. There is a fundamental distinction between “long-form” and “wide-form” data tables, and seaborn will treat each differently.
Long-form data
Wide-form data
Bokeh
Bokeh is an interactive visualization library that targets modern web browsers for presentation. It is good for:
Interactive visualization in modern browsers Standalone HTML documents, or server-backed apps Expressive and versatile graphics Large, dynamic or streaming data Easy usage from python (or Scala, or R, or…)